AgNotate
Quick Start Guide
Introduction
Thank you for your interest in AgNotate by AgriGates! This guide will help you get started with downloading, installing and creating your first project with AgNotate.
Table of Contents
- AgNotate
1. System Requirements
Before beginning, ensure your system meets the following requirements:
- Operating System: Windows 10 or 11
- Ram: Minimum 4GB, 8GB Recommended
- Disk Space: At least 1GB
2. Download and Installation
Download the Installer
- Visit our AgNotate download page to download the AgNotate Installer
- Download the unified installer.
Installing
- Locate the downloaded unified installer.
- Double-click the installer executable file to begin the install.
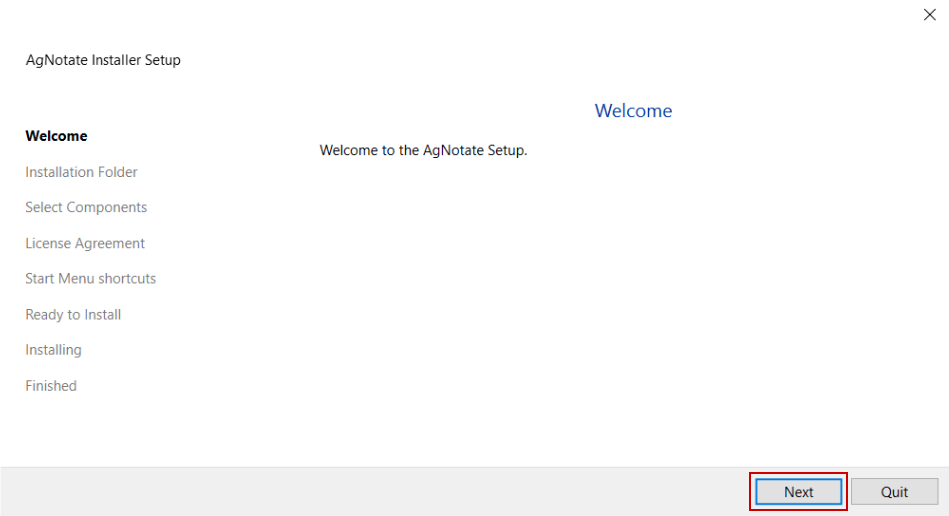
- Follow the on-screen instructions to complete the installation.
- Click next
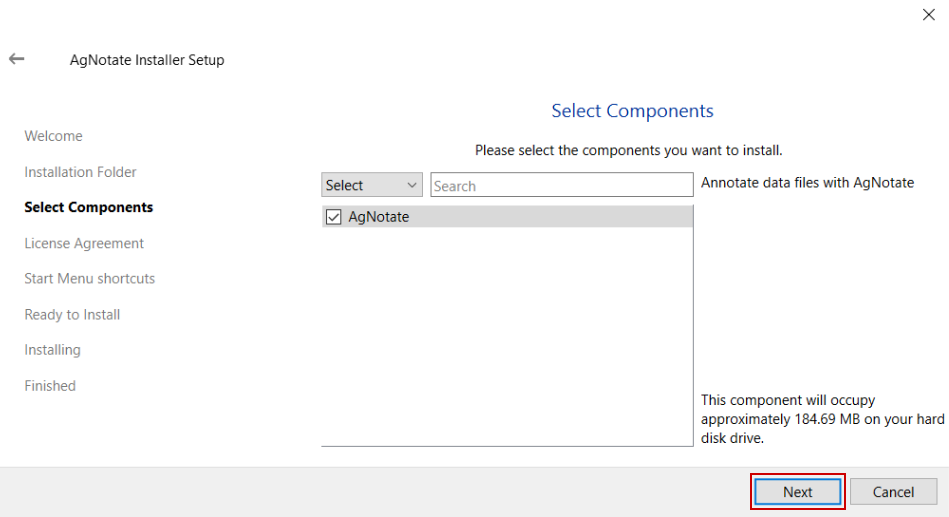
- Select where you want AgNotate to install (Default: program files)
- Select if you want a desktop shortcut or not [1]

- Keep defaults
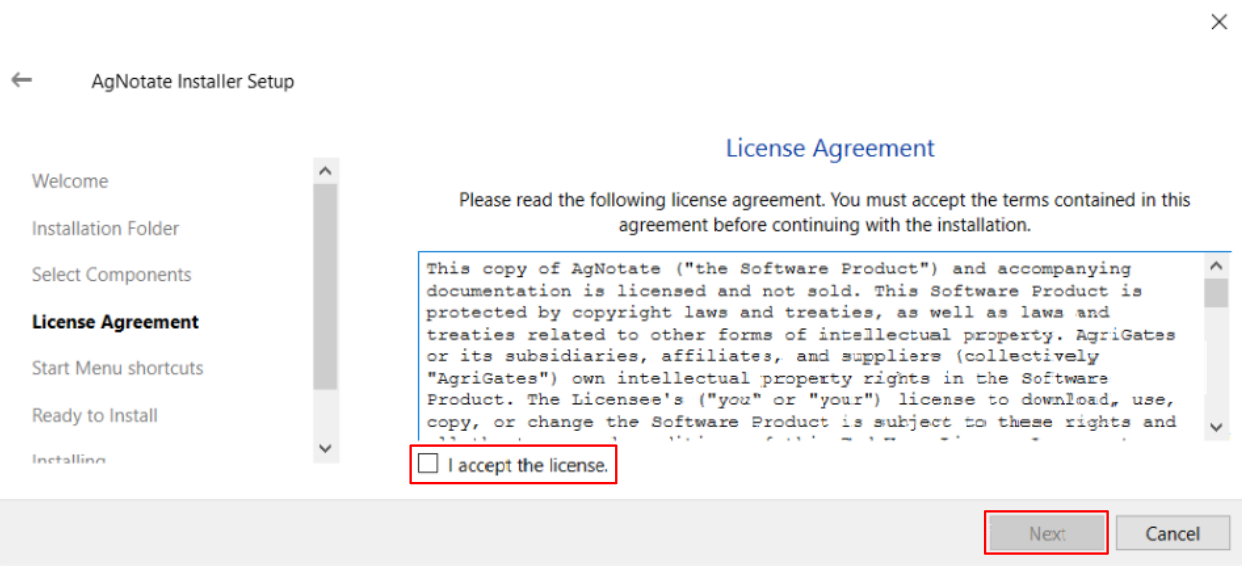
- Read and accept the AgNotate License and press next
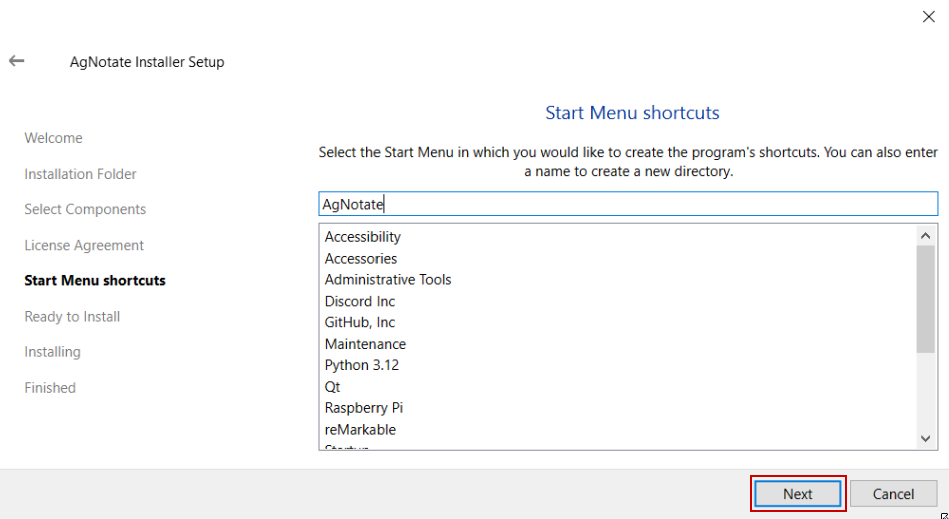
- Keep Default
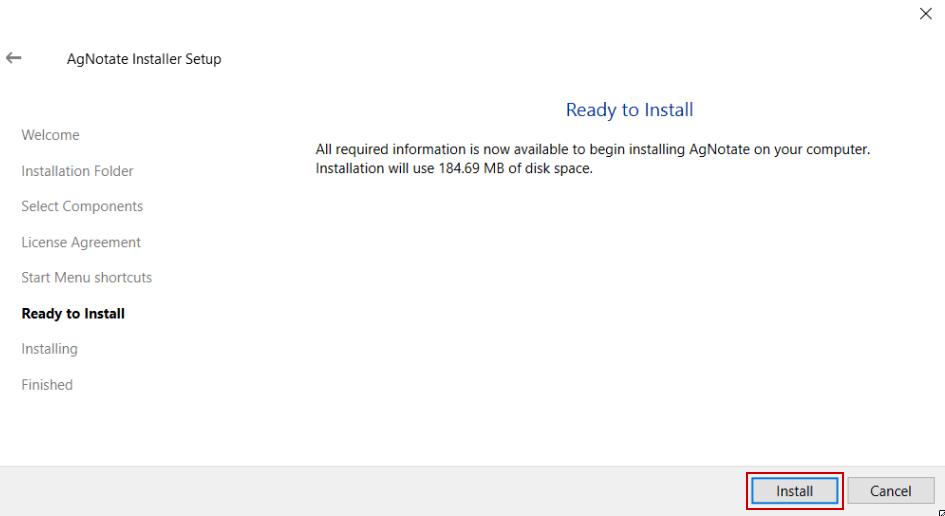
- AgNotate is ready to install, press Install
- Let the installer run
- You are ready to start using AgNotate!
3. Initial Setup
Launching AgNotate
- After installation, if you selected to create a desktop shortcut you can double-click the desktop icon.
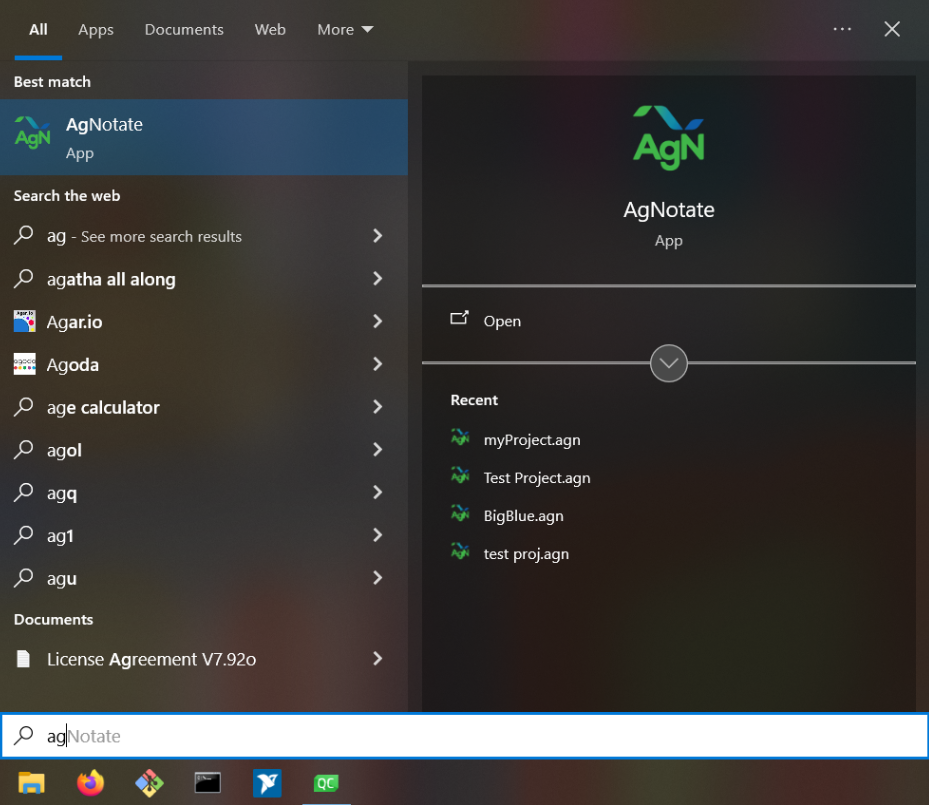
- Alternatively, you can search for AgNotate in your start menu
Preparing your data
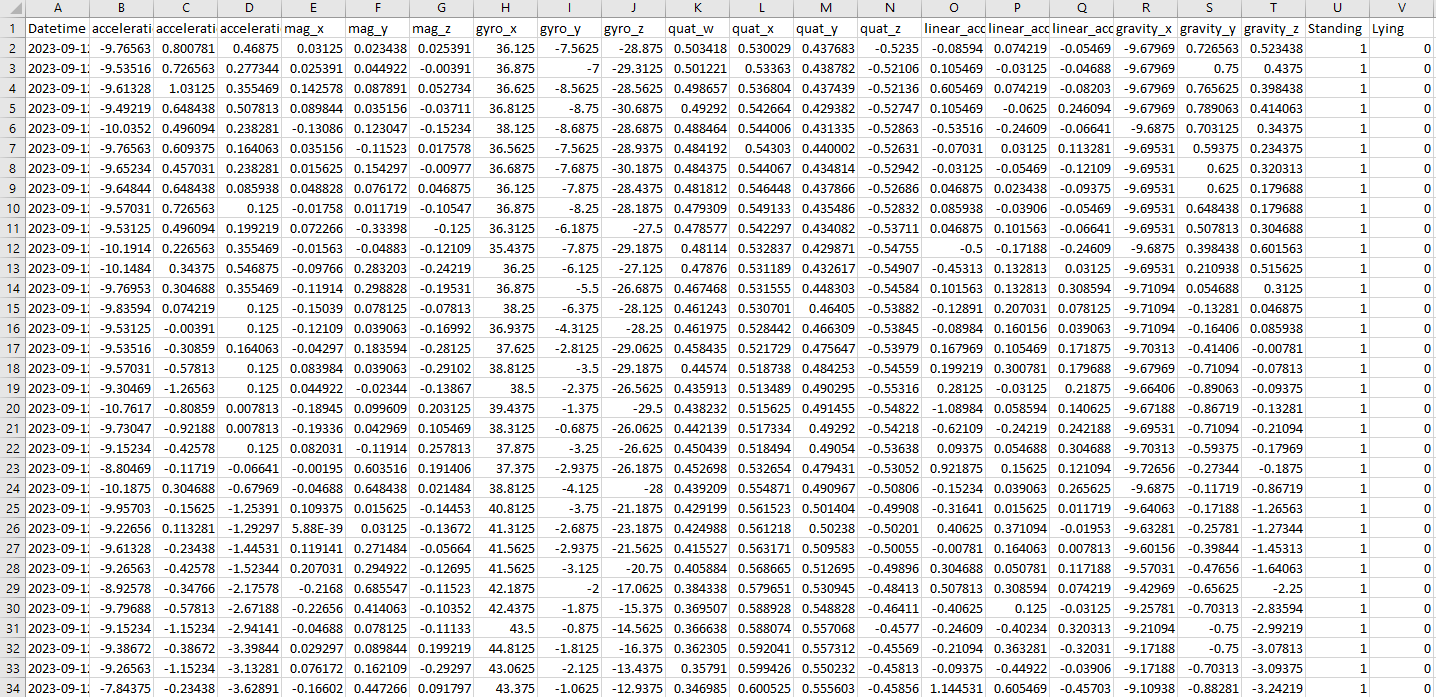
- Any data set needs to have a
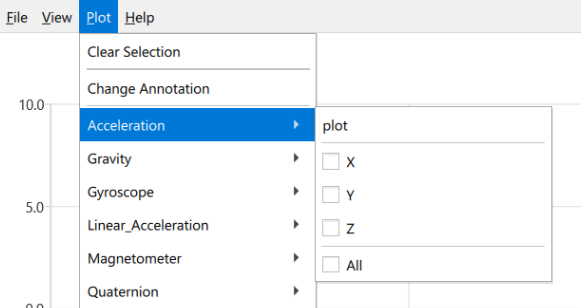
Datetimecolumn that uses the ISO 8601-1:2019/Amd 1:2022 standard for Datetime formatting. This includes the Calendar Date standard and Time standard. - To use AgNotate to the best of its abilities it is best to prepare your data before annotating it. AgNotate will automatically sort data headers into similar categories. This is handled though underscores ‘_’ to be compatible with both CSVs and SQL databases. This sorting looks like:
Acceleration_X, Acceleration_Y, Acceleration_Z
However it is important to note that data types are case sensitive. For example, if your data headers were:
acceleration_X, Acceleration_Y, AcCeLeRaTiOn_Z
- Note: Currently AgNotate does NOT support non-alphanumeric characters other than underscores in any data header. (` ~ $ ^ + = < > \ “ ! @ # & ( ) – [ { } ] : ; ', ? / @ # % &)
Then your data headers would not be sorted together. - With importing your own videos you need to use the following structure, specifically your video needs to match the timestamp of the data you are wanting to view. The durations of the video files can be any duration: i.e. 1 hour, 1 minute, 1 day, etc.
- Note: Longer duration video source files may experience greater time shifting over time and not line up fully with data
video/ (folder name can be anything)
├── YYYYMMDD-HHMMSS.mp4
└── YYYYMMDD-HHMMSS.mp4
- Note: Currently AgNotate does NOT support video only annotation, a time series dataset is required to annotate.
4. Creating Your First Project
Starting a New Project
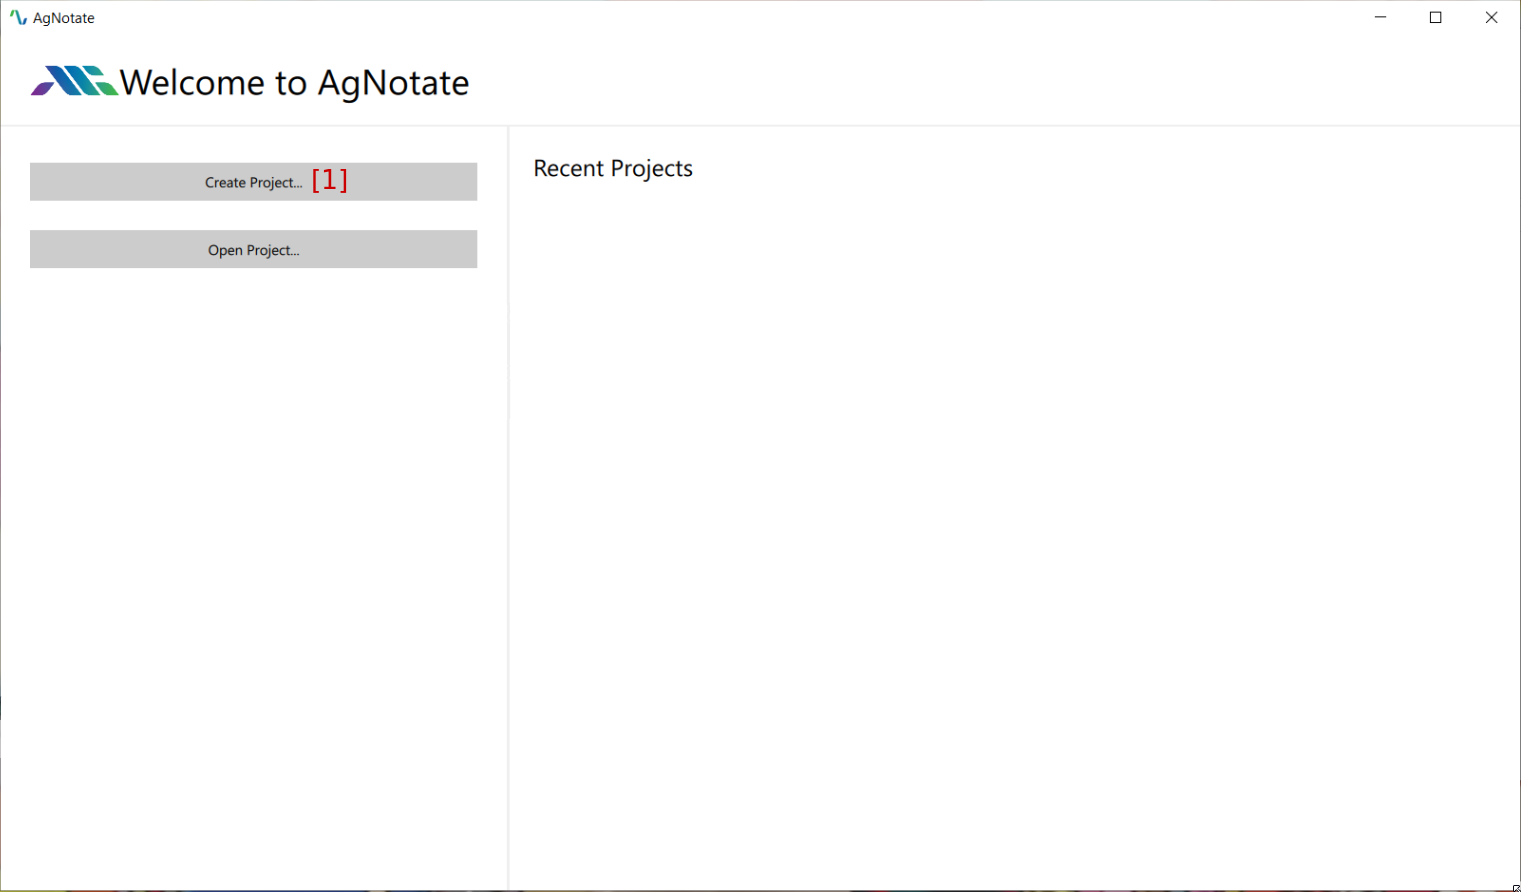
- Click on "Create Project…" [1] on the welcome screen
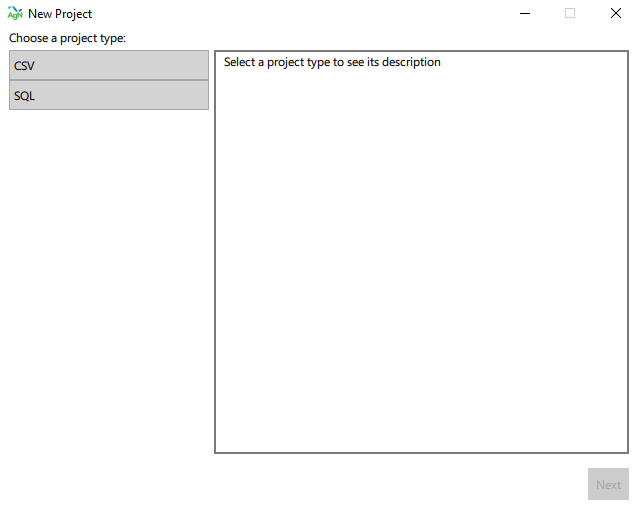
- Choose a project type: this is the type of timeseries data you are importing into AgNotate, either CSV data or SQL data.
CSV Project
- Select your data source [1], datetime format from your data [2], and an optional video folder [3], click next

- Browse to enter a name and save location for the data [1]. Optionally enter information regarding the animals you are annotating (i.e. holstein dairy calves) [2], this information will be required for a future feature we are developing. Enter the behaviors you will be annotating on the data set [3], press the add button [4] to create a new blank behavior or select a behavior and press remove [5] to delete behaviors or. Once done, click next.

- Review the project summary to make sure everything is how you want it [1]. Click Finish.

SQL Project
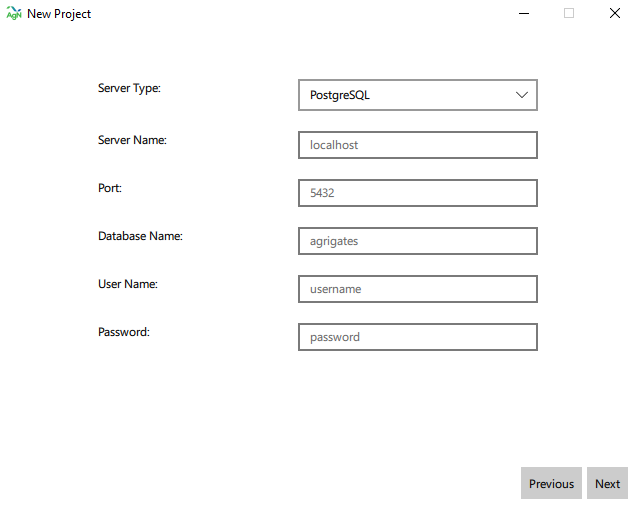
3.AgNotate currently only supports PSQL databases. Enter the connection credentials then click next. AgNotate will attempt to connect with those credentials, and if the connection fails, AgNotate will alert the user.
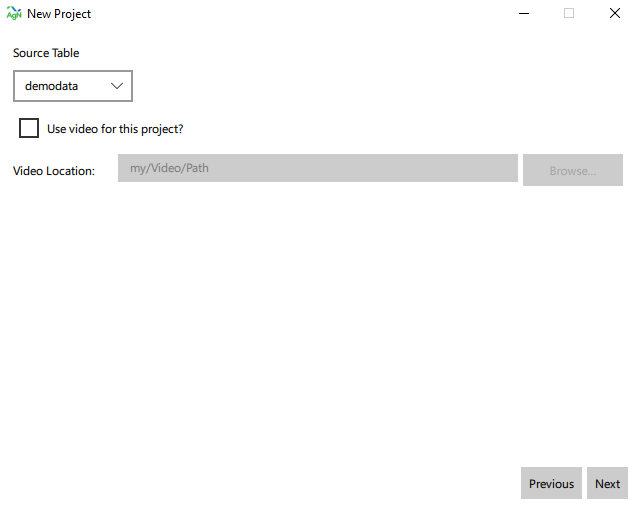
- Select your data source [1]. AgNotate will only display tables with a datetime column, and the remaining columns all being float values. There is also an optional video folder input [2], click next.
- Browse to enter a name and save location for the data [1]. Optionally enter information regarding the animals you are annotating (i.e. holstein dairy calves) [2], this information will be required for a future feature we are developing. Enter the behaviors you will be annotating on the data set [3], press the add button [4] to create a new blank behavior or select a behavior and press remove [5] to delete behaviors or. Once done, click next.
- Review the project summary to make sure everything is how you want it [1]. Click Finish.
5. Behavior Editing (Ethograms)
The user can navigate to behavior editing tab to provide more details about the behaviors they wish to annotate.

Here the user can add [1] or remove [2] behaviors, and edit their names [3]. The user can give more details about the behaviors by writing descriptions [4], assigning hotkeys [5], changing the colors [6], and configuring the exclusion [7] and transition [8] tables.

The exclusion and transition tables are entirely optional, but they will assist the user by preventing certain annotations from being made. For instance, if the user selects that "Standing" and "Lying" annotations should be exclusive, AgNotate will prevent the user from creating overlapping "Lying" and "Standing" annotations.

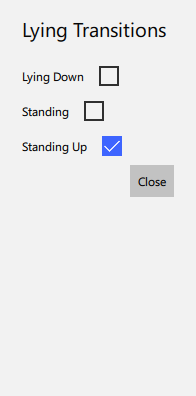
Similarly, the transition table will create even more constraints on the exclusion annotations. The table prevents specified excluded behaviors from happening back to back. For instance, in our example screenshot, a "Standing" annotation cannot happen directly after a "Lying" annotation, there must be a "Standing Up" annotation in between them.
6. AgNotate Main Window
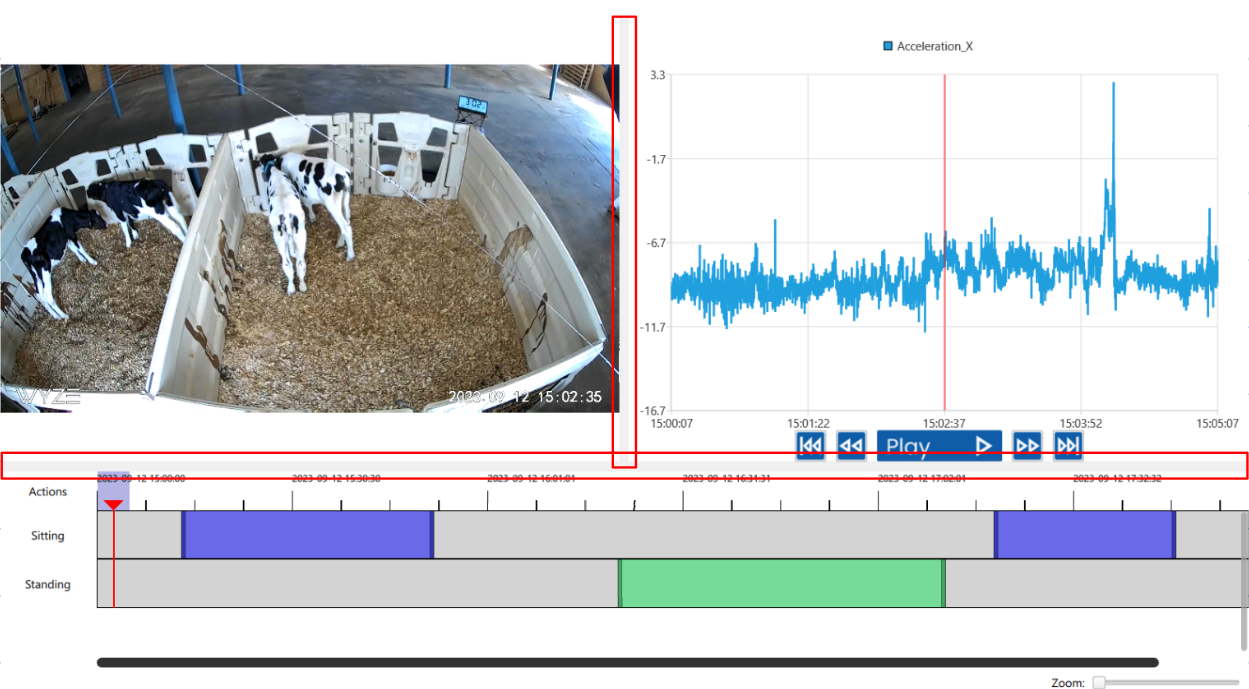
The main window has many different tools and buttons. At the bottom is the annotation widget. This is where the user annotates the behaviors of the animals, using the behaviors detailed in the behavior editing tab. The user can adjust the sizes of the regions by clicking and dragging the boundaries highlighted in red.
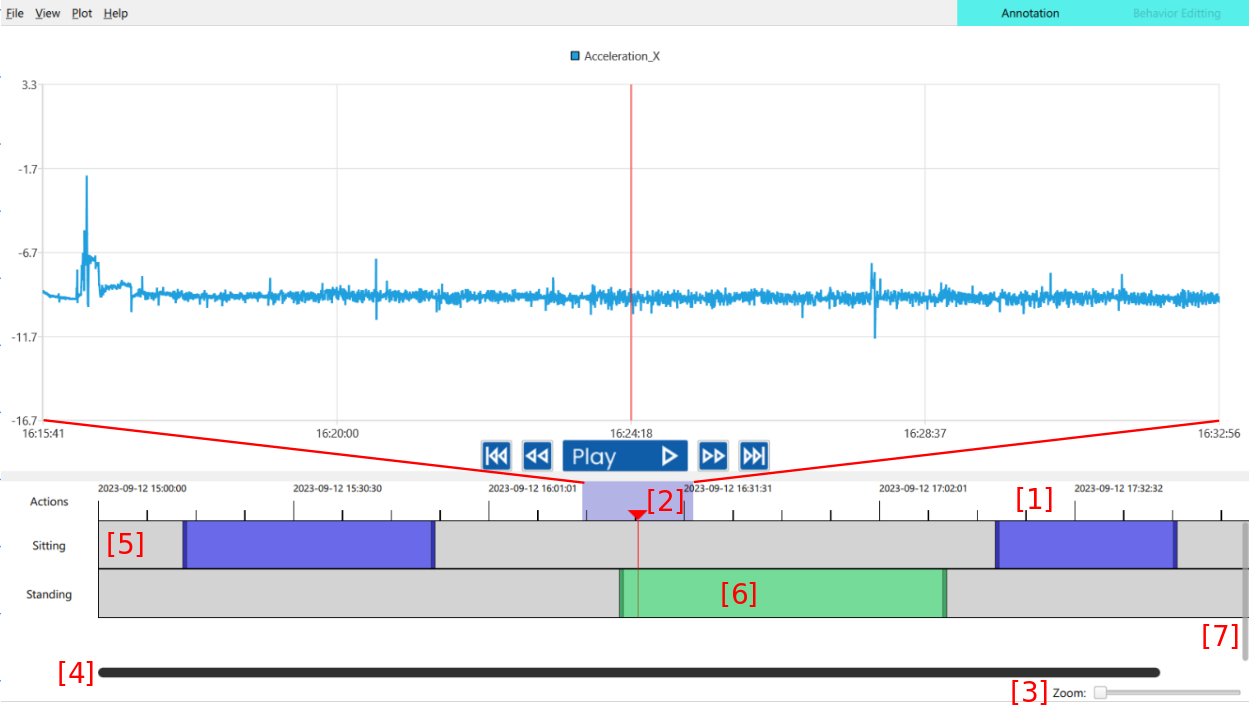
Annotation Widget
The user can scroll through the data by clicking and dragging across the timeline [1]. The red line notes the current position in the data both in the graph, as well as the video, and the highlighted box [2] at the top of the red line shows the window region of the graph. By default the timeline covers the entire dataset that the user load in, but this can be changes with the zoom slider [3] in the bottom right. Once zoomed in, the user can slide the timeline by using the main slider [4]. The user clicks and drags on one of the behavior tracks [5] to create annotations. Once an annotation is made [6], the user can click and drag the center to move the annotation side to side, or grab the edges to adjust just one bound. If the user has more behaviors than what fits in the section, they can adjust the region sizes, or use the scroll bar on the side [7].
7. Saving and Exporting Data
Saving your work
- To prevent accidental behavior/annotation deletions. AgNotate does not autosave projects. Whenever you have unsaved pending data there will be a ‘*’ on the title of the AgNotate window.
- To save your data, use either the
ctrl + shotkey or save through theFile->Save Projectbutton. Your project has been recently saved if there is no ‘*’ on the title bar. Additionally, if you try to close AgNotate or a project with unsaved data, a popup will appear asking if you want to save before quitting.
Exporting Data
- After annotating your dataset, you can export the resulting csv file with your annotations from the
File->Export Annotations to CSV...button. This will prompt you for a folder that you want to export your data to.

- The csv created will be named
export_{PROJECT NAME}.csv. By exporting your data, you will append a boolean true or false onto the end of your data set for every behavior you annotated.
8. Tips and Best Practices
Data interaction shortcuts
Try to get comfortable with the graph output. Not only does is visualize the data but it is also user interactive:
- Left click + drag to create an annotation just by clicking/dragging
- Right click + drag to move the graph around on both the x-axis and y-axis
- Scroll in/out to zoom the y-axis
Keyboard shortcuts (hotkeys)
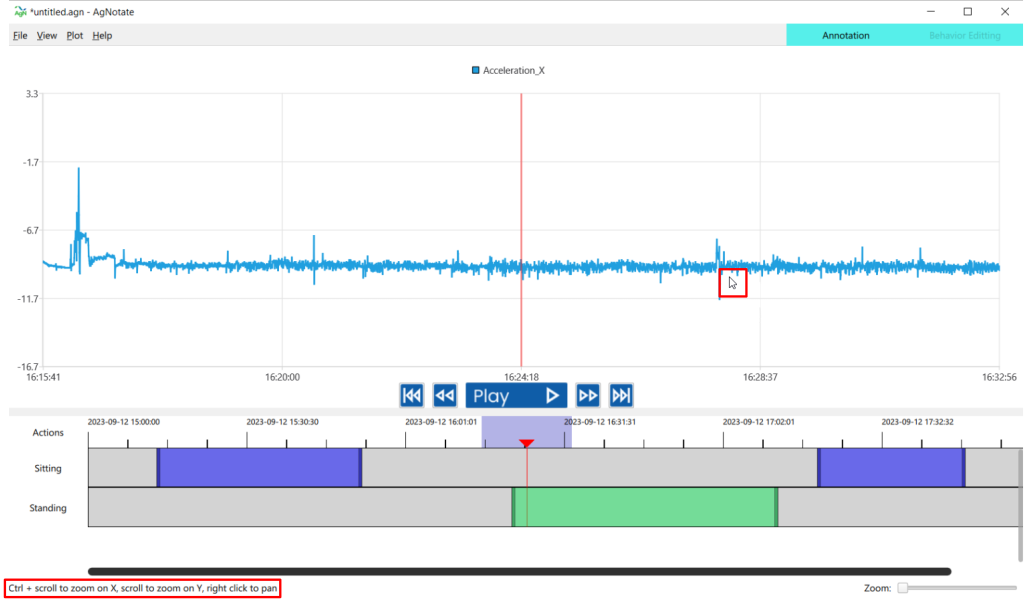
- For regional keyboard shortcuts i.e. shortcuts that only happen when the mouse is hovering over the graph, there is an output in the bottom left corner of the UI with some of the functions:
Global
| operation | shortcut |
|---|---|
| Undo | ctrl + z |
| Redo | ctrl + y |
| Save | ctrl + s |
Data View
| operation | shortcut |
|---|---|
| Zoom In X Axis | ctrl + scroll up |
| Zoom Out X Axis | ctrl + scroll down |
| Zoom In Y Axis | scroll up |
| Zoom Out Y Axis | scroll down |
| Pan | hold right click + drag |
File Structure
Organizing your file structure is imperative to efficiency of annotating. Because the AgNotate project files do not contain your source data. We recommend a file structure similar to:
project name/
├── (optional) video/
│ ├── YYYYMMDD-HHMMSS.mp4
│ └── YYYYMMDD-HHMMSS.mp4
├── myproject.agn
└── mydata.csv
9. Troubleshooting and Support
I get to the end of the project creation wizard and press finish but nothing happens.
This is likely caused by trying to create the project (.agn) file in a directory that you don't have write permission for. Try to select a different location and try again.